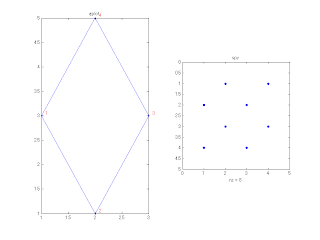
%----------------- MATLABソース -----------------%
r = 1;
c = 2;
A = [
  %1 2 3 4
   0 1 0 1; % 1 ノード1は、ノード2,3に隣接ため、1
   1 0 1 0; % 2 ノード2は、ノード1,3に隣接ため、1
   0 1 0 1; % 3 ノード3は、ノード2,4に隣接ため、1
   1 0 1 0  % 4 ノード4は、ノード1,3に隣接ため、1
   ];
xy = [
   1 3; % ノード1の座標
   2 1; % ノード2の座標
   3 3; % ノード3の座標
   2 5  % ノード4の座標
   ];
subplot(r,c,1);
gplot(A,xy,'.--');
text(xy(:,1)+0.1,xy(:,2)+0.05,('1234')', 'HorizontalAlignment','center','color','red');
title('gplot');

subplot(r,c,2);
spy(A); %行列 S のスパースパターンをプロットします。
title('spy');
print('-dpng','-r100','gplot.png');
%----------------- MATLABソース -----------------%
実行の結果

0 件のコメント:
コメントを投稿